My Technical Analysis Diary. . . . .Invest in stocks only after you have done your own Risk Management
Showing posts with label Candle Stick chart. Show all posts
L&T refueling . . .
L&T had a very good upmove. Now we see evening star formation. In case L&T trades below 1698 it will correct till 1630 levels just to refuel and fire a new rally. Target of 2100 was already given earlier.
Nifty 5970~6000 support firming up
As already pointed in earlier posts 5970 is acting as good support for Nifty.
Now we have Hammers at bottom of the current correction.
Hammer in Nifty .
Hammer ends the current bearish correction. Will see some upward movement in next week.

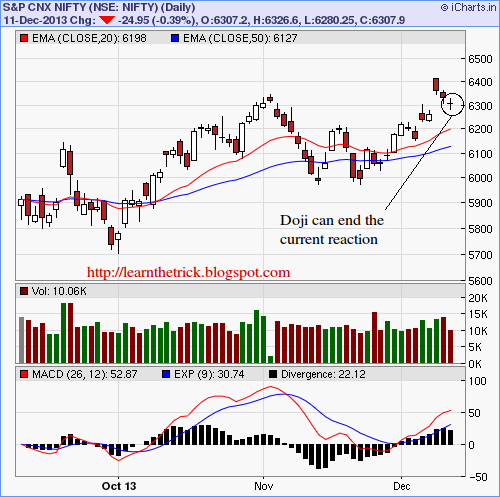
Doji Confirmation on Nifty
Doji confirmation in Nifty means that the corrective down trend has ended. As stated earlier SL of 6100 can be maintained

Labels:
bullish,
Candle Stick chart,
NIFTY
Bata India reaction completed
After breakout above 1000 Bata has now reacted and given buying opportunity with SL of 1000. Inverted black hammer is confirmed since it traded above yesterday's candle
Labels:
bullish,
Candle Stick chart,
stoploss
Subscribe to:
Posts (Atom)