TISCO request. . . !

As requested by my friend Raghu here is the chart of Tata Steel

after breaking the downtrend today it is down with very high volume

on the news of TISCO buying CORUS. As it is going to increase cash

outflow from TISCO books this was expected.


The up trend can only be considered if TISCO takes support at the green

support line as shown in chart. Hence I would wait for few days for

trend to be clear in this counter.
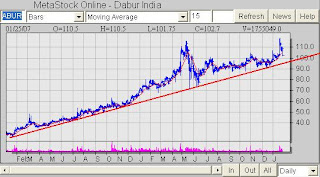
DABUR INDIA CHART


The red trendline is a very long term trendline as can be seen
from the attached chart hence I expect Dabur to take support
at 96~97 level. One can enter closer to 98~97 level so that
the Stop Loss is close enough to reduce your risk.
I was always Biased against the line charts and preferred Candle stick chart over them. Now learning needs an open mind. So I have started thinking that nothing is perfect hence I tired line chart for this one as I suspected a definite conclusion here.


Line chart is clearly showing resistance becoming support in Moser Baer
while the candle stick chart is creating confusion. While one can also see
that the volumes are healthy on the days when buying was seen.
I am watching this counter for monitoring if my conclusion is correct.


Well today the stock went X bonous hence the price it quoted was @104~106 the bonus ratio is 1 on every 2 shares hence 106*3/2 makes 160 so one can enter with Stop Loss of 98~99
Google