Havells another Resistance to Support

After break out above 575 with good volume. Havells have taken support at around 580 levels. This is a good bullish signal here.

Check the chart for reference. Break above the green resistance line would signal the new rally in this counter.

Stop Loss can be places at 580~575.

L&T resistance becoming support

As told earlier L&T had given breakout. It has consolidated well in November.

In the following chart you can find that resistance becoming support and its a good
bullish signal in this chart.


One can go long with the Stoploss at around 3950 level.

RNRL MIDAS Support

As discussed earlier I was to do the MIDAS analysis of the RNRL stock I have created a support line for the RNRL.

using 20th AUG 2007 as the base and it comes to 110

while using 19th Oct 2007 as base the support comes to 141 . .


If you study the MIDAS method you will find that the MIDAS supports are dynamic and changes with time. Hence if the prices of this stock falls the MIDAS support will also change.

Nifty looking weak

Nifty is loosing "On Balance Volume". Since last peak the OBV is making new lows which means that long positions on nifty are being liquidated while be prices are sustaining.

I suggest every one to Maintain and execute the stoploss as they occur.

RNRL Breakout

RNRL have again shown breakout after consolidation. Refer the chart.


First target can be considered to be 135. Also do read my earlier posts on RNRL


I would be trying to apply MIDAS and find out the target using the TOPFINDER algorithm.

5400 a good support for Nifty

Considering the On Balance Volume and the movement of the Nifty. I find that the OBV is not making new high as against Nifty. While a good support have come at 5400 level.


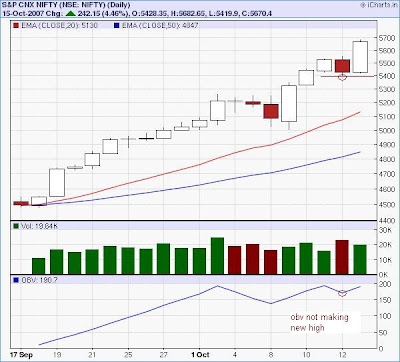
In My view till 5400 is broken one can stay long.

L&T Breakout

There is good revaluation occuring in the L&T. Check the attached chart it has gone up and broken the cealing of the trend. This breakout indicates the strong uptrend.


As L&T is a very liquid stock some amount of consolidation will occur in this counter before it gets further upmoves.

RNRL heading to 52

As suggested in last post you can see that above 4375 on NIFTY outlook is bullish. So now Nifty is heading for the new highs.

While all the Reliance stocks are showing heavy buying interest I am posting the chart of RNRL (As I am having this on in my portfolio).


After breaking of 48 level with good volume one can expect to see the 52 very quickly.

Nifty near Resistance

Nifty would be facing resistance nr 4375 Level. While this might not be considered as the Sell Call but above 4375 level one can go Bullish all the way. . .

Suzlon heading 1000 ~ 1025 Level

Suzlon appears weak on the chart. You can see that the trendline is prevelant in this counter. Earlier it has taken support on this trendline smartly. One can wait for simmilar opportunity to arrive in next 10~15 days.


IPCL at support

After good amount of buying interest IPCL have now cooled down and now is at a short term trendline support.

340 would be Stop Loss for this counter.

Nifty Takes support at 200 days Moving avg.

With today's opening gap it is clear that Nifty have found support. Its nr 200 days Moving avg. so the low of 17th of 4002 makes an important support now.


200 days EMA comes to 4040. The bearish indications given in the earlier post seems to have ended.

It is now indication that the traders have to now switch their caps from bears to bulls.


Nifty might head to 4250

While trying to analyze I find that the head and shoulder pattern is apperent. Considering the neckline and the height of the pattern one can see that the predictable fall of 200 points is possible from the neckline.

The neck line can be roughly put at 4450 and hence we might see the Nifty seeing 4250 level. I would not trade based on this call but would be cautious in my action.

Do post your comments . . .

RPL at channel support

While the friday crack was heavy RPL seems to have landed right at the trendline support in the bottom of the channel. As can be seen that RPL has fallen with good amout of volume (which is a bad news). Its wait and watch for this counter. In case it does not break the support 109~110 level one can take a long position with minimum risk.

PENNANT in SAIL??

As stated by me earlier on this counter it is bullish and is in channel.

SAIL have shown breakout today from the Pennent. Target of
175 can be placed on this counter based on this breakout which
would also coinside with the top of the channel which was being
discussed.


As I stated in the reasons why I give these tips for free, I received this
stock idea from one of the visitor so having e-friends helps.
Thanks to Mr Chandrasekhar for this stock idea.

Hotel Leela at a long term trend line . . .

As pointed out in earlier post Hotel leela have good support but did not break on the upside but now it is at a very good level wherein it is at the long term trend line. If it takes support from this level one can easily consider target of 55 with SL of close below 50. And in case of breakout above 55 it would be a good bonus. While enter this stock only after it starts its up move from here which migth be in a day or two.


No points for gussing losses if you are not serious with your stoploss as indicated earlier by me.

SAIL channel

One of the visitor of blog have pointed out the there is pannent in the SAIL and I looked at it. While He had spoted it well and there is also breakout on the up side but the volume at the breakout is not very convinsing and movement would be sideward to upward.


While I would like to highlight the Channel in this stock. Till the time the channel is not broken on the lower side one can stay bullish on this stock.

IDEA celular in uptrend

IDEA has seen good buying support and there is a good trendline support in it. Currently it was forming the triangle with the resistance line as shown below. The resistance has been broken with good volume support as indicated in the following chart.

I am bullish on this counter and it has upside of about 10~15 Rs. In all cases the bottom trendline is very good to monitor.

Punj In Channel

Looking at the chart it seems that after breakout Punj Lloyd seems to be in the rising channel. SL can be now arround 265 Level.

265 level is arrived by considering that the stock closes below the bottom of the channel. Those thinking to go long on this counter can wait for it to bounce from the 265 levels.


Praj giving bearish signal

Praj has broken the channel bottom with good volume I consider this as a bearish signal. It would move down for short term.


Punj Lloyd waiting to make new highs . .

After breaking out with good volumes Punj Lloyd was consolidating at the earlier high of 250. It is most likely to break the old high of 250. Today it is already trading above 250 with heavy volume.

Today if it closes above 250 it is most likely to reach new high on re-rating.

StopLoss of 233~235 to be maintained here.

RNRL resistance 2 support . .

While this is a line chart which I usually do not use but my experience with the Moser Baer's case study proved that they are as important hence I also keep my eye on the line charts.

Here it is clear that resistance is becoming support.

By this assumption one can keep SL of 32 for RNRL. While on the whole the script have got good momentum.

Infosys at support

As can be seen from the chart given below it is clear that 1900 level looks as a good support for infosys. Considering multiple attempt made by the stock to break it have failed I thing its a support being defended by many.

Now considering the current market price of 1950 one is very close to Stop Loss which reduces your risk (ie Loss in case the stoploss is activated) . This makes taking long postition in Infosys a very low risk proposition.


Ranbaxy at resistance

As can be seen from attached chart ranbaxy is facing resistance on the down trendline. Up move would now come only after break of 400~415 level resistance with good volume.

On the brighter side it has also taken support on the up trendline at 375. Now 375 is good support and the stock will surly find direction in next few days to come.

Hotel Lela bottoming out

There is clear indication in this counter about the bottom fishing. There is a good volume support. (ie the volume picks have come on the day the prices have risen) and if it closes above 62 one can buy it with target of 67.5.

The target is arrived at considering the resistance level of earlier consolidation. If you are holding this stock then 54 should be your Stop loss. Stop loss as can be seen is arrived using the New Up trendline (SL LINE in red). Hence the Stop loss keeps on rising as the time goes by.

Neyvelli Lignite double top at 68

Neyvelli lignite is not showing much improvement in the On Balance Volume. While It has made the double tops at the 68 level as can be clearly seen from the attached chart. Further up move might be only confirmed after we see breaking of 68 level.
I was having position in this stock hence was monitoring it. Now I have squared off the position after looking at this picture.

Suzlon Inverted Flag

Suzlon have now given the bearish flag.
Check the chart and the target of 1050~1025 would achieved once it breaks the 1110 level.

While for the second time I am trying to point out the flag. Hope it works out correct.

Neyvelli Lignite followup

I am happy that I had identified the Flag earlier and it worked out fine while the target given by me was 69 which should have been 68 (Lesson learnt).

Now that you can see that after breaking the flag the Stock rose till 67.95.
Revisiting this chart now throws some more light. It shows that there have been good volume peaks on the days when the candles are while (ie the stock rose). This is really good sign of buying interest in the stock. I expect it to break 68 level in style while the last two days low of 65 would act as good support hence I think we need to keep the Stop Loss at 64.90.

Parsvanath Breakout . . . .

During the down trend all the stock makes the trendline joining the tops. This is the down trendline. I have found that Once this down trendline is broken with a good volume the stock rises and the bull phase begins.


This phenomena is seen in Parsvanath Developers. Yesterday's close above 324 have made is a good breakout case. Now for the traget we can assume 2 rising trendline from the tops. As below
We can then safely kkeep the target of 375 and 390 respectively.

Falling Wedge in SEAMEC . . .!

Breakout from falling wedge is a good bullish indication. This can be seen in the SEAMEC's chart given below. The volume support is also good during the breakout. In this type of pattern its difficult to predict the target. I have tried to predict the target using the older resistance line.From the above chart it seems that this stock is heading for 205.

RNRL heading to 34


On the weekly chart you can see that RNRL is now above the resistance line. Now one can expect it to move to 34 level easily.

NALCO trendline


Just Spotted a trendline in NALCO. While its more of academics now since the stock is already away from this trendline. There is currently a good volumes with which NALCO is trading. It might face resistance nr 265 level. Wait and watch is what I would be doing for it.

Sesa goa waiting for direction


You can see the good resistance building at 1850 level while the rising trendline is also valid. It can any time breakout on either direction. While the long position can only be taken only after close above 1850 is seen and rather with the handsome volume.

2000 would be next level where the resistance would come if it closes above 1850. While close below 1700 would give bearish signal.

Reliance migh be doing double top


Reliance might be upto doing the double top (reversal pattern) after the long run-up while it is yet to be proven one have to keep a cautious view on this one.

Flag in Neyvelli


This is for the first time that I have identified the Flag pattern. While let me see if there is some success in it. By the books Stop Loss to be 60.90~61 and Target on breakout from flag would be 69.

Pfizer at resistance


Pfizer facing resistance at 875 level

Bajaj Hindustan in Channel


Since I have a position in this I am monitoring it.

It seems that Bajaj hindustan is forming a good channel. If it bounces from 180 Level it is a good buy with SL of about 175.

RNRL heading to 27 . . .

RNRL can be seen heading to 27 level.


While also from the next chart it can be made out that there is good volume support at 22 level.

Followup on Nifty


Things seems to have got cleared and the trend-line is proving true for time being.

Fib level in M&M

Thanks to Linux, after long time I can now see my icicidirect's technical charts.

Well in this chart you can find the fibbonacci levels for the Mahindra and Mahindra. It has taken support at 690 level and again taken resistance at 810 level.

As there is already good buying support from 690 I feel it to act as good support and one can take long position with SL of 690.

Mahindra & Mahindra double bottom in making


Here I feel there is making of double bottom.
700 level should act as a good support for M&M.


This is reversal sign hence stock should now move
up if it sustain above 700 Level.

Also On Balance Volume is improving showing some
buying interest in this stock at 700 Level.

Nifty nr possible trendline


3650 Level for nifty might work out as a good support. The scenario would be clear only after tomorrow's trade.


Bajaj Hinustan Breakout . . !

As expected Bajaj Hindustan has shown sign of
reversing.

Now closing at 183 with handsome volume makes
it the candidate of breakout.


Simplex Infrastructure on request .

On request of one of the visitor here is the chart of Simplex infrastructure which seems to have taken good support on the long term trend-line and is likely to bounce.

If it breaks and goes below the bottom trend-line the assumption of the trend-line would be violated hence the Stop Loss : 270~274 levels.

Target : 345~350 is based on the resistance level arrived based on the falling trend-line.

Polaris bouncing from 200 Days EMA


My experience is that the long term investors like Mutual funds keep 200 days Exponential Moving avg as an indicator to re-enter the stocks they are betting for long term. Polaris is seeing such buying. One can buy this stock with Stop Loss of 145~149 Level.

Bajaj Hindustan might reverse


It can be seen that there is buying interest in Bajaj Hindustan. Also there is Inverted Head and shoulder reversal pattern seen. I would advice people to buy this stock only after break of the falling trend line ie above 190~200 level.

Google