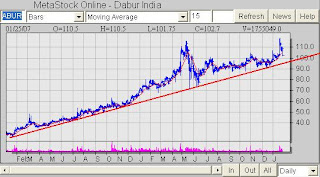
DABUR INDIA CHART

The red trendline is a very long term trendline as can be seen
from the attached chart hence I expect Dabur to take support
at 96~97 level. One can enter closer to 98~97 level so that
the Stop Loss is close enough to reduce your risk.
from the attached chart hence I expect Dabur to take support
at 96~97 level. One can enter closer to 98~97 level so that
the Stop Loss is close enough to reduce your risk.
1 comment:
Dabur 97 on 23rd FEB and now moving up. Enter with SL of 96
Post a Comment